Login
LoginComputer Aided Detection (CAD) in Radiology

- Introduction to computer aided detection (CAD) in radiology
- What is mammography and how has CAD helped?
- Imaging by chest CT: Detection of lung nodules and cancer
- Prediction of lung function after an operation
- Digital chest radiography
- Coronary artery disease
- Liver
- Colon
- Brain
- Magnetic resonance imaging of the brain
- Summary and conclusions
Introduction to computer aided detection (CAD) in radiology
Radiology is a particular field of medicine that uses imaging technology to help doctors diagnose and treat diseases. A radiograph involves exposing a particular part of the body (that is to be imaged) to a small dose of ionising radiation. This produces pictures of the inside of the body.
Over the years, radiological examinations are now increasing in complexity and consist of hundreds of images per study. With this increased complexity, the radiologist’s failure to detect an abnormality is higher than previously seen. This is even when an expert radiologist works under ideal conditions. Interpretation errors (errors of diagnosis) are less frequent. This has lead to the use of computers, in what is now known as Computer Aided Detected (CAD) in radiology. A computer can continue to view films and pictures indefinitely, as it does not get tired like humans do.
What is mammography and how has CAD helped?
Mammography involves using low dose X-rays to examine and view the human breast. It is widely used as a screening tool in women for breast cancer. CAD has been shown to be useful in mammography.
In the USA in 1998, an automated software program which could act as a second set of eyes to assist the radiologist to read mammograms was approved by the FDA. The CAD unit sells for US $200,000 but is not 100% sensitive. (Sensitivity is a measure of how well a test identifies the positive cases).
A study performed by radiologists and science officers found that the computer sometimes fails to mark an area the human radiologist thinks may be a cancer. The fact that the CAD did not locate the lesion does not mean there is no cancer and it is very important that the patient is still reviewed and recalled. On the other hand, experienced radiologists have been known to miss cancers.
In a study conducted in 2002, 1000 mammograms were reviewed. These mammograms were from women who had a ‘normal looking’ earlier mammogram, but who were now diagnosed with breast cancer. 67% of those cancers were visible on the earlier mammogram. Some only had very slight changes, but 27% were visible and required further action (instead of being called normal). This 27% of mammograms were exposed to CAD, and this technology picked up 77% of those cancers, which had previously been described as normal by radiologists.
In the United Kingdom National Breast Screening Program, 10,267 mammograms were obtained in women aged 50 years or older. A single reading with CAD led to 6.5% more cancers being detected than with double reading (ie the mammograms were reviewed twice) by radiologists. However, there was also an increased percentage of women (32%) who were recalled, to come back for further investigation with CAD.
Imaging by chest CT: Detection of lung nodules and cancer
CT scanning (also known as CAT scanning) is a non-invasive type of medical imaging that helps doctors diagnose and treat medical conditions. CT scans use multiple x-rays from special imaging equipment to produce many images of the inside of the body. A computer system then works to join them together.
Chest CT scans allow us to obtain a much more detailed view of the body’s internal organs behind the rib cage, such as the lung and also allows views of the ribs, other bony structures and soft tissues.
The first CAD system for CT images of lung was approved in 2004 and 2006 by the FDA. This CAD system was to act as a second reader of chest multi-detector CT scans (MDCT). Their main function was to pick up any abnormalities and alert the radiologist to lesions that they may have been missed in their first reading. Images from a MDCT scanner are received, the CAD unit processes the data and marks regions of interest / abnormality. The radiologist can then perform a second review of the scan, reviewing the areas that the CAD has highlighted.
In 2006, an analysis of 150 low-dose screening CT studies of lung was performed. Nodules (small rounded masses of tissues) seen in the lungs were classified by their size, density and location. CAD detected 72.6% of true nodules and nodules in 4% patients not identified by radiologists. This resulted in a change to the follow-up protocol. A combination of review by the radiologist and by CAD was necessary to identify a total of 1,106 nodules in the 150 patients.
A lung screening program has found that the rate of overall nodule detection by CAD is 70% sensitive in 10mm thick, low dose, CT scans. When the method was applied and trained specifically to look for malignant nodules, a sensitivity of 80% was attained.
This automated computer detection method needs to also be compared against findings from a radiologist. In addition, software programs that contain information as to whether a nodule is benign or malignant would also be helpful when used in conjunction with CAD.
There was a study using thin CT slices (1mm thick) to compare the characteristics of malignant nodules, compared to benign nodules. 222 cases were studied, consisting of 59 cancers and 163 benign nodules. The results showed that malignant nodules were more often round in shape, and consisted of a mixed texture, made of varying opacities. In the solid nodules, a polygon shape or smoothed margin was seen more often when the lesion was benign.
However, the true test to determine whether a lesion is benign or malignant is a biopsy. This involves the removal and examination of a sample of tissue directly from the lesion. Another study reviewing high-resolution CT (HRCT) findings of small nodules resected from the lungs was conducted in 2006. 223 nodules which were 2cm or less in diameter were studied. A characteristic appearance was identified in lung cancers known as adenocarcinoma. These types of cancers demonstrated a mixed solid and opaque (non see through) appearance. Indentation of the lining of the lung was found in 75.2% of adenocarcinomas and another type of lung cancer known as squamous cell carcinoma. However, this finding was also found in benign conditions such as inflammation, e.g. tuberculosis, so this feature is not specific for malignancies.
These criteria that the study identified could help distinguish different types of cancers and lesions, and would be helpful if incorporated into the software programs for CAD. This would allow the computer system to provide more information on the likely nature of a lesion.
A five-year study was performed by the Mayo Clinic using CT scans to screen for lung cancer. Their initial results did not support the possibility of reducing the overall deaths from lung cancer. Concern was raised about the false-positive results and overdiagnosis actually resulting in more harm than good. False positive results mean that a lesion might be identified as a cancer or suspicious for a cancerous mass, but in fact, it is not.
CT screening permits detection of a large number of benign lung nodules. These will be expensive to diagnose and may have an impact on general well-being and mortality if we intervene. With computer assisted detection allowing us to identify even more nodules, the benefits and ethical issues must all be considered carefully.
Prediction of lung function after an operation
A software tool developed by Beyer and a team of other researchers allows us to predict the likelihood of operating and expected outcome in some patients with lung cancers. This uses a chest multi-slice CT and results from lung function tests that are performed in the patient prior to the operation.
Digital chest radiography
A study looked at how useful CAD systems were on 50 cases of lung cancer which were thought to be amenable to operation, compared to 50 normal control patients. Digital chest radiography equipment was used to evaluate the cases. Overall, the CAD system was able to detect 74% of the lung cancer cases.
Coronary artery disease
CT scans can be used to determine and score the amount of calcium found inside the heart vessels. This should then be followed up with another procedure called CT angiography. However, there are certain factors that interfere with the machine’s ability to accurately visualise and diagnose the amount of calcium present in the heart vessels. These include: massive amounts of calcium present in the arteries, long standing disease or previous heart surgeries such as coronary artery bypass grafts / stent implantations, older age and diabetes mellitus.
Liver
A 3 dimensional technique allowing shape based analysis was applied to CT scans to detect local recurrence of tumours, after ablation with radiowaves.
Colon
CT scans of the colon can help identify polyps using CAD. This also allows further enhancement with 3 dimensional viewing, to improve the radiologist’s accuracy in classifying true polyps vs false polyps.
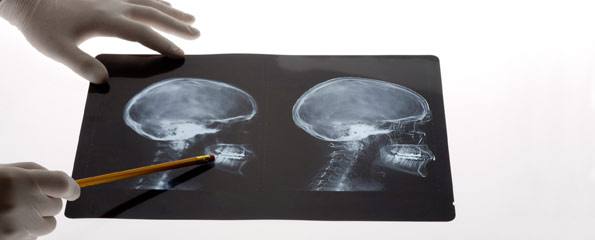
Brain
CT scans using automated methods are possible due to the nature of the CT scan. Automation means using control systems such as computers to control machines and processes, replacing the need for human operators.
A study conducted by Maidjian and other team members developed an automated method to identify areas of lower density within certain parts of the brain in patients who had suffered a stroke. These results were compared with the opposite side of the brain. The software correctly diagnosed 10 out of 15 patients who had suffered a stroke. There were 2 patients who were incorrectly diagnosed as having negative results and one patient who was diagnosed with a stroke, who had not had one. This was compared to readings performed by human observers, where 5 patients were incorrectly diagnosed with having negative results. All of these incorrect readings were correctly identified by the software system.
A more comprehensive automated technique could be achieved by comparing the new, abnormal finding against a normal set of standard pictures in a database. A system was set up, which linked landmarks on the skull and face with structures on skull radiographs. The next step is for the skulls to be transformed by a process known as ‘warping’ so the two skulls are made the same shape. Then a technique called pattern matching can try and match up the internal structures seen, identifying any abnormalities.
This more comprehensive technique described above was tested and developed by another study group. They developed a prototype (ie an original type or model, which can serve as a basis or standard for later development – ie you may have seen car prototypes being advertised on television), that allowed the CT scan of the head of a new patient to be compared, slice by slice, with another case from a database. This database contains images which have been considered by human observers to be normal and have no focal abnormality.
If there is a localised abnormality found in the new case, the radiologist can then easily consult a library of examples from different disease categories with a few clicks of the mouse. The system adjusts for the fact that the two patients will have heads of different sizes.
There is still ongoing work in this area, so comparisons can eventually be made by the software. Software is also available to detect bulges / swellings in the blood vessels of the brain (known as aneurysms) at the base of the skull. This is achieved by automated computer systems being able to play around with and analyse the bony structures of the skull, from CT angiograms.
Magnetic resonance imaging of the brain
Diffusion Tensor Imaging (DTI) is a type of magnetic resonance imaging (MRI) that allows us to measure the amount of diffusion that occurs in the water in our tissues. Diffusion is the process in which there is movement of a substance from an area of high concentration of that substance to an area of lower concentration.
MRI scanning uses magnetic and radiowaves – ie avoiding exposure to X-rays or other forms of radiation. If you have ever had an MRI before, you will be familiar with lying inside a large, cylinder shaped magnetic field. Radiowaves are directed through your body, which affect the many atoms inside the body. The nuclei in the atoms are forced into a different position. When they eventually return to the correct position, they send out their own signals and the scanner picks up these signals.
Our body consists of a large proportion of water. Water is made up of a combination of hydrogen and oxygen atoms. The nucleus of a hydrogen atom is used to create an MRI scan. Tissue that contains the least hydrogen atoms (eg bones) will turn out darker on the scan, whereas tissue that has many hydrogen atoms (eg fatty tissue) will turn out lighter and brighter on the scan.
The word anisotropic means having properties that differ according to the direction of movement. This is especially in crystals or tissue. The properties can include: strength, elasticity, conduction of heat or electricity, etc. Diffusion of water in tissue is three dimensional – water can move in all directions and the mobility of water varies according to the direction of movement.
In an MRI scan, the molecules move along the direction of the magnetic gradient. By looking at water’s diffusion anisotropy, we can detect water’s variation from areas of different concentration, when it changes direction. White matter (nerve tissue containing special fibres and is almost white in colour) in the brain and spinal cord is organised in specific bundles that run parallel to each other. Diffusion of water is quickest in the direction of the fibres.
Using this feature, the orientation of the white fibre tracts in the brain can be mapped out and provide us with information in diseases such as multiple sclerosis and alzheimer’s disease. As the white matter increases with age, the degree of diffusion anisotrophy increases. This finding can be used to assess brain maturation in children, newborns or premature babies.
Summary and conclusions
We have seen many developments in computer software that can assist the radiologist in detecting abnormalities that are present. Some of these examples include: bulges / swellings in arteries that are located close to bone on CT scans, or individual white matter bundles in the nervous system on MRI, which would otherwise remain invisible to the human eye.
The computer can also be trained to locate abnormalities that are usually be picked up by radiologists, but which may be overlooked in a busy environment. There remains room for further development and refinement in areas such as determining whether an abnormality is an area of tissue that has lost its blood supply, or whether a mass is benign or malignant. However, at the end of the day, the final reading and interpretation of any abnormality rests with the reporting radiologist. They have to weigh up all of the findings in the whole clinical picture and also integrate their own experience.
Kindly written by:
Clinical Professor Lesley Cala
MD DMRD FRANZCR FRCR,
Editorial Advisory Board Member: Virtual Neuro Centre, School of Surgery and Pathology, The University of Western Australia, and Australian Research Centre for Medical Engineering, Murdoch University.
References
- Armato SG 3rd, Roy AS, Macmahon H, Li F, Doi K, Sone S, Altman MB. Evaluation of automated lung nodule detection on low-dose computed tomography scans from a lung cancer screening program (1). Acad Radiol 2005 Mar; 12 (3) : 337-346.
- Beyer F, Heindel W, Hoffknecht P, Kuhnigk J, Dicken V, Lange T, Thomas M, Wormanns D. Rofo 2006 Sep; 178 (9) : 872-879. Abstract only in English.
- Bricault I, Kikinis R, Morrison PR, Vansonnenberg E, Tuncali K, Silverman SG. Liver metastases: 3D shape-based analysis of CT scans for detection of local recurrence after radiofrequency ablation. Radiol 2006 Oct; 241 (1) : 243-250.
- Cala LA, Parker K, Emelyanova I, Hicks N, Linggard R, Robbins P, Attikiouzel Y, Michalak K, Mastaglia FL. Computer-aided diagnosis (CAD) of cranial CT scans. Rivista de Neuroradiologica 2003; 16 : 947-952.
- Dewey M, Hamm B. Cost effectiveness of coronary angiography and calcium scoring using CT and stress MRI for diagnosis of coronary artery disease. Eur Radiol 2006 Oct 10; [Epub ahead of print].
- Gilbert FJ, Astley SM, McGee MA, Gillan MG, Boggis CR, Griffiths PM, Duffy SW. Single reading with computer-aided detection and double reading of screening mammograms in the United Kingdom National Breast Screening Program. Radiol 2006 Oct; 241(1) : 47-53.
- Hadjiiski L, Sahiner B, Helvie MA, Chan HP, Roubidoux MA, Paramagul C, Blane C, Petrick N, Bailey J, Klein K, Foster M, Patterson SK, Adler D, Nees AV, Shen J. Breast masses: computer-aided diagnosis with serial mammograms. Radiol 2006 Aug; 240 (2) : 343-356.
- Le Bihan D, Mangin J-F, Poupon C, Clark CA, Pappeta S, Molko N, Chabriat H. Diffusion tensor imaging: concepts and applications. J Magn Reson Imaging 2001 ; 13:534-546.
- Li F, Sone S, Abe H, Macmahon H, Doi K. Malignant versus benign nodules at CT scanning for lung cancer: comparison of thin-section CT findings. Radiol 2004 Dec; 233 (3) : 793-798.
- Maidjian JA, Chalela J, Kasner SE, Liebeskind D, Detre JA. Automated CT segmentation and analysis for acute middle cerebral stroke. AJNR 2001 Jun-Jul; 22(6): 1050-1055.
- Musto C, Simon P, Nicol E, Tanigawa J, Davies SW, Oldershaw PJ, Arcuri N, Fox K, Di Mario C. 64-multislice computed tomography in consecutive patients with suspected or proven coronary artery disease: initial single center experience. Int J Cardiol 2006 Aug 10; [Epub ahead of print].
- Nakashima Y, Yamada T, Tanahashi M, Hikosaka Y, Yoshitomi H, Niwa H. A study of high-resolution computed tomography (HRCT) findings of resected small pulmonary nodules 2 cm or less in diameter with reference to the malignant nature. Kyobu Geka 2006 Sep; 59 (10) : 917-922.
- Pitman AG. Perceptual error and the culture of open disclosure in Australian radiology. Australas Radiol 2006; 50: 206-221.
- Sakai S, Soeda H, Takahashi N, Okafuji T, Yoshitake T, Yabuuchi H, Yoshino I, Yamamoto K, Honda H, Doi K. Computer-aided nodule detection on digital chest radiography: validation test on consecutive T1 cases of resectable lung cancer. J Digit Imaging 2006 Jun 14; [Epub ahead of print].
- Shi R, Schraedley-Desmond P, Napel S, Olcott EW, Jeffrey RB Jr, Yee J, Zalis ME, Margolis D, Paik DS, Sherbondy AJ, Sundaram P, Beaulieu CF. CT colonography: influence of 3D viewing and polyp candidate features on interpretation with computer-aided detection. Radiol 2006 Jun; 239 (3) : 768-776.
- Swensen SJ, Jett JR, Hartman TE, Midthun DE, Mandrekar SJ, Hillman SL, Sykes A-M, Aughenbaugh GL, Bungum AO, Allen KL. CT screening for lung cancer: five-year prospective experience. Radiol 2005 Apr; 235:259-265.
- Tomandi BF, Hammen T, Klotz E, Ditt H, Stemper B, Lell M. Bone-subtraction CT angiography for the evaluation of intracranial aneurysms. AJNR 2006 Jan; 27 (1) : 55-59.
- Ulissey MJ, Roehrig J. Mammography – computer-aided detection. emedicine 2005. http://www.emedicine.com/radio/topic879.htm.
- Warren Burhenne LJ, Wood SA, D’Orsi CJ, Feig SA, Kopans DB, O’Shaughnessy KF, Sickles EA, Tabar L, Vyborny CJ, Castellino RA. Potential contribution of computer-aided detection to the sensitivity of screening mammography. Radiol 2000; 215(2): 554-562.
- Yuan R, Vos PM, Cooperberg PL. Computer-aided detection in screening CT for pulmonary nodules. AJR 2006 May ; 186 (5) : 1280-1287.
- Yue W, Yin D, Li C, Wang G, Xu T. Automated 2-D cephalometric analysis on x-ray images by a model-based approach. IEEE Trans Biomed Eng 2006 Aug; 53 (8) : 1615-1623.
Dates
Tags
Created by: